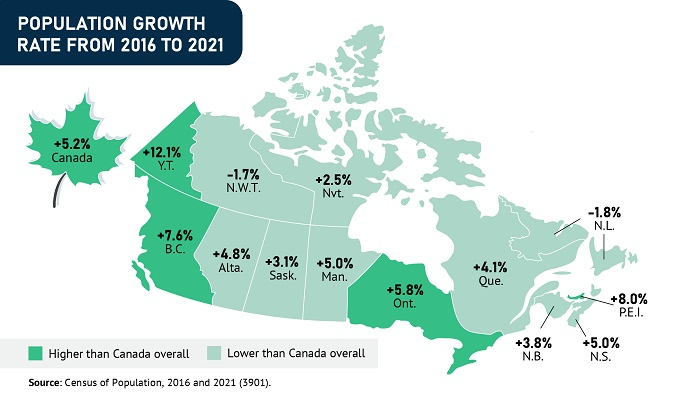
36,991,981 people live in Canada according to the 2021 census. Statistics Canada has released the details of the 2021 census which finds that Canada’s population has grown by 5.2% from the last census.
According to the census, Canada is the fastest-growing country in the G7 and migratory growth accounted for most of the population growth.
2021 Census Highlights
Credit: Statistics Canada
- Canada’s Population according to 2021 census: 36,991,981
- Of 1.8 million people increase in population, 80 per cent increase was due to migratory growth.
- The population of the Maritimes grew at a faster pace than the Prairie provinces for the first time since the 1940s due to rising immigration levels and an influx of Canadians migrating from other parts of the country.
- The population of Newfoundland and Labrador declined by 1.8%.
- Yukon’s population increased by +12.1% — the fastest pace nationally since the last census.
- Among the provinces, Prince Edward Island experienced the fastest growth with an increase of 8 %.
- Nearly three in four Canadians or close to 27.3 million people live in one of Canada’s 41 large urban centres.
- 6.6 million Canadians (6,601,982) were living in a rural area in May 2021, an increase of 0.4%.
- Urban areas grew at a rate of 6.3%.
Population of Canada’s Provinces
- Ontario’s population grew to 14,223,942, an increase of 5.8%. This is a faster pace than Canada’s overall population from 2016 to 2021, the first time this has happened since the 2006 Census.
- The population of British Columbia is now exceeded five million people (5,000,879) and it is the only province in Western Canada where population growth (+7.6%) has exceeded the national average of 5.2%.
- The populations of prairie provinces grew at a slower pace from the last census — Manitoba (+5.0% to 1,342,153), Saskatchewan (+3.1% to 1,132,505) and Alberta (+4.8% to 4,262,635).
- The population of Nunavut increased to 36,858, but grew at a slower pace (+2.5%) than the national average, while the population of the Northwest Territories fell (-1.7% to 41,070).
| Population, 2021 | Population, 2016 | Population density per square kilometre, 2021 | |
|---|---|---|---|
| Canada | 36,991,981 | 35,151,728 | 4.2 |
| Ontario | 14,223,942 | 13,448,494 | 15.9 |
| Quebec | 8,501,833 | 8,164,361 | 6.5 |
| British Columbia | 5,000,879 | 4,648,055 | 5.4 |
| Alberta | 4,262,635 | 4,067,175 | 6.7 |
| Manitoba | 1,342,153 | 1,278,365 | 2.5 |
| Saskatchewan | 1,132,505 | 1,098,352 | 2.0 |
| Nova Scotia | 969,383 | 923,598 | 18.4 |
| New Brunswick | 775,610 | 747,101 | 10.9 |
| Newfoundland and Labrador | 510,550 | 519,716 | 1.4 |
| Prince Edward Island | 154,331 | 142,907 | 27.2 |
| Northwest Territories | 41,070 | 41,786 | 0.0 |
| Yukon | 40,232 | 35,874 | 0.1 |
| Nunavut | 36,858 | 35,944 | 0.0 |
Population Growth of Municipalities, Cities & Towns
- Canada’s two largest municipalities –Toronto (+2.3%) and Montréal (+3.4%) – grew at a slower pace than Canada overall.
- No CMA in Canada saw a population decline from 2016 to 2021.
- Over one-third of Canadians (13.1 million people) live in the three largest CMAs of Toronto, Montréal and Vancouver.
- Toronto (6,202,225 people) remains the most populous CMA, followed by Montréal (4,291,732 people) and Vancouver (2,642,825 people).
- The population of Montréal increased by 3.4% and Calgary by 5.5%.
- Edmonton (+8.3%) and Ottawa (+8.9%) surpassed the 1 million mark between 2016 and the 2021 censuses.
- Four of the five fastest growing CMAs in the country were located in British Columbia from 2016 to 2021: Kelowna (+14.0% to 222,162), Chilliwack (+12.1% to 113,767), Nanaimo (+10.0% to 115,459) and Kamloops (+10.0% to 114,142).
- According to the 2021 census, there were 27 municipalities in Canada.
- As of 2021, there were 27 municipalities in Canada. The top 25 municipalities have a combined population of over 16 million people, this represents 44.1% of the total population living in Canada.
- Topping the list of the fastest-growing municipalities in Canada was East Gwillimbury (+44.4%) in Ontario.
- Resort destinations like Squamish in British Columbia, Canmore in Alberta and Wasaga Beach and Collingwood in Ontario are among the fastest growing communities in Canada.
CMA’s in Canada According to Population
Statscan Definition: A census metropolitan area (CMA) is formed by one or more adjacent municipalities centred on a population centre (known as the core). A CMA must have a total population of at least 100,000 based on data from the current Census of Population Program, of which 50,000 or more must live in the core based on adjusted data from the previous Census of Population Program. Census metropolitan areas (CMAs) and census agglomerations (CAs) are considered to be large, densely populated centres made up of adjacent municipalities that are economically and socially integrated.
In the 2021 census, Canada had 41 census metropolitan areas with more than 100,000 people, up from 35 in the previous census. The six new large urban centres are Fredericton, Drummondville, Red Deer, Kamloops, Chilliwack and Nanaimo.
| CMAs | Population | |
| 1 | Toronto | 6,202,225 |
| 2 | Montréal | 4,291,732 |
| 3 | Vancouver | 2,642,825 |
| 4 | Ottawa – Gatineau | 1,488,307 |
| 5 | Calgary | 1,481,806 |
| 6 | Edmonton | 1,418,118 |
| 7 | Québec | 839,311 |
| 8 | Winnipeg | 834,678 |
| 9 | Hamilton | 785,184 |
| 10 | Kitchener – Cambridge – Waterloo | 575,847 |
| 11 | London | 543,551 |
| 12 | Halifax | 465,703 |
| 13 | St. Catharines – Niagara | 433,604 |
| 14 | Windsor | 422,630 |
| 15 | Oshawa | 415,311 |
| 16 | Victoria | 397,237 |
| 17 | Saskatoon | 317,480 |
| 18 | Regina | 249,217 |
| 19 | Sherbrooke | 227,398 |
| 20 | Kelowna | 222,162 |
| 21 | Barrie | 212,856 |
| 22 | St. John’s | 212,579 |
| 23 | Abbotsford – Mission | 195,726 |
| 24 | Kingston | 172,546 |
| 25 | Greater Sudbury / Grand Sudbury | 170,605 |
| 26 | Guelph | 165,588 |
| 27 | Saguenay | 161,567 |
| 28 | Trois-Rivières | 161,489 |
| 29 | Moncton | 157,717 |
| 30 | Brantford 3 | 144,162 |
| 31 | Saint John | 130,613 |
| 32 | Peterborough | 128,624 |
| 33 | Lethbridge | 123,847 |
| 34 | Thunder Bay | 123,258 |
| 35 | Nanaimo | 115,459 |
| 36 | Kamloops | 114,142 |
| 37 | Chilliwack | 113,767 |
| 38 | Belleville – Quinte West | 111,184 |
| 39 | Fredericton | 108,610 |
| 40 | Drummondville | 101,610 |
| 41 | Red Deer | 100,844 |
Top 100 Cities & Towns* in Canada
- StatsCan Definition – Census Subdivision*: Census subdivision (CSD) is the general term for municipalities (as determined by provincial/territorial legislation) or areas treated as municipal equivalents for statistical purposes (e.g., Indian reserves, Indian settlements and unorganized territories). Municipal status is defined by laws in effect in each province and territory in Canada.
North Vancouver appears twice in the list as District of North Vancouver (69th) which surrounds the City of North Vancouver (96th).
| CSD — City/Municipality/Town | Province or territory | Population 2021 | Population 2016 | |
| Canada | … | 36,991,981 | 35,151,728 | |
| 1 | Toronto | Ont. | 2,794,356 | 2,731,571 |
| 2 | Montréal | Que. | 1,762,949 | 1,704,694 |
| 3 | Calgary | Alta. | 1,306,784 | 1,239,220 |
| 4 | Ottawa | Ont. | 1,017,449 | 934,243 |
| 5 | Edmonton | Alta. | 1,010,899 | 933,088 |
| 6 | Winnipeg | Man. | 749,607 | 705,244 |
| 7 | Mississauga | Ont. | 717,961 | 721,599 |
| 8 | Vancouver | B.C. | 662,248 | 631,486 |
| 9 | Brampton | Ont. | 656,480 | 593,638 |
| 10 | Hamilton | Ont. | 569,353 | 536,917 |
| 11 | Surrey | B.C. | 568,322 | 517,887 |
| 12 | Québec | Que. | 549,459 | 531,902 |
| 13 | Halifax | N.S. | 439,819 | 403,131 |
| 14 | Laval | Que. | 438,366 | 422,993 |
| 15 | London | Ont. | 422,324 | 383,822 |
| 16 | Markham | Ont. | 338,503 | 328,966 |
| 17 | Vaughan | Ont. | 323,103 | 306,233 |
| 18 | Gatineau | Que. | 291,041 | 276,245 |
| 19 | Saskatoon | Sask. | 266,141 | 247,201 |
| 20 | Kitchener | Ont. | 256,885 | 233,222 |
| 21 | Longueuil | Que. | 254,483 | 239,897 |
| 22 | Burnaby | B.C. | 249,125 | 232,755 |
| 23 | Windsor | Ont. | 229,660 | 217,188 |
| 24 | Regina | Sask. | 226,404 | 215,106 |
| 25 | Oakville | Ont. | 213,759 | 193,832 |
| 26 | Richmond | B.C. | 209,937 | 198,309 |
| 27 | Richmond Hill | Ont. | 202,022 | 195,022 |
| 28 | Burlington | Ont. | 186,948 | 183,314 |
| 29 | Oshawa | Ont. | 175,383 | 159,458 |
| 30 | Sherbrooke | Que. | 172,950 | 161,323 |
| 31 | Greater Sudbury / Grand Sudbury | Ont. | 166,004 | 161,531 |
| 32 | Abbotsford | B.C. | 153,524 | 141,397 |
| 33 | Lévis | Que. | 149,683 | 143,414 |
| 34 | Coquitlam | B.C. | 148,625 | 139,284 |
| 35 | Barrie | Ont. | 147,829 | 141,434 |
| 36 | Saguenay | Que. | 144,723 | 145,949 |
| 37 | Kelowna | B.C. | 144,576 | 127,390 |
| 38 | Guelph | Ont. | 143,740 | 131,794 |
| 39 | Trois-Rivières | Que. | 139,163 | 134,413 |
| 40 | Whitby | Ont. | 138,501 | 128,377 |
| 41 | Cambridge | Ont. | 138,479 | 129,920 |
| 42 | St. Catharines | Ont. | 136,803 | 133,113 |
| 43 | Milton | Ont. | 132,979 | 110,128 |
| 44 | Langley | B.C. | 132,603 | 117,285 |
| 45 | Kingston | Ont. | 132,485 | 123,798 |
| 46 | Ajax | Ont. | 126,666 | 119,677 |
| 47 | Waterloo | Ont. | 121,436 | 104,986 |
| 48 | Terrebonne | Que. | 119,944 | 111,575 |
| 49 | Saanich | B.C. | 117,735 | 114,148 |
| 50 | St. John’s | N.L. | 110,525 | 108,860 |
| 51 | Thunder Bay | Ont. | 108,843 | 107,909 |
| 52 | Delta | B.C. | 108,455 | 102,238 |
| 53 | Brantford | Ont. | 104,688 | 98,563 |
| 54 | Chatham-Kent | Ont. | 103,988 | 101,647 |
| 55 | Clarington | Ont. | 101,427 | 92,013 |
| 56 | Red Deer | Alta. | 100,844 | 100,418 |
| 57 | Nanaimo | B.C. | 99,863 | 90,504 |
| 58 | Strathcona County | Alta. | 99,225 | 98,024 |
| 59 | Pickering | Ont. | 99,186 | 91,771 |
| 60 | Lethbridge | Alta. | 98,406 | 92,729 |
| 61 | Kamloops | B.C. | 97,902 | 90,280 |
| 62 | Saint-Jean-sur-Richelieu | Que. | 97,873 | 95,114 |
| 63 | Niagara Falls | Ont. | 94,415 | 88,071 |
| 64 | Cape Breton | N.S. | 93,694 | 94,285 |
| 65 | Chilliwack | B.C. | 93,203 | 83,788 |
| 66 | Victoria | B.C. | 91,867 | 85,792 |
| 67 | Brossard | Que. | 91,525 | 85,721 |
| 68 | Maple Ridge | B.C. | 90,990 | 82,256 |
| 69 | North Vancouver (District) | B.C. | 88,168 | 85,649 |
| 70 | Newmarket | Ont. | 87,942 | 84,224 |
| 71 | Repentigny | Que. | 86,100 | 84,285 |
| 72 | Peterborough | Ont. | 83,651 | 81,032 |
| 73 | Saint-Jérôme | Que. | 80,213 | 74,346 |
| 74 | Moncton | N.B. | 79,470 | 71,889 |
| 75 | Drummondville | Que. | 79,258 | 75,423 |
| 76 | Kawartha Lakes | Ont. | 79,247 | 75,423 |
| 77 | New Westminster | B.C. | 78,916 | 70,996 |
| 78 | Prince George | B.C. | 76,708 | 74,003 |
| 79 | Caledon | Ont. | 76,581 | 66,502 |
| 80 | Airdrie | Alta. | 74,100 | 61,581 |
| 81 | Wood Buffalo | Alta. | 72,326 | 71,594 |
| 82 | Sault Ste. Marie | Ont. | 72,051 | 73,368 |
| 83 | Sarnia | Ont. | 72,047 | 71,594 |
| 84 | Saint John | N.B. | 69,895 | 67,575 |
| 85 | Granby | Que. | 69,025 | 66,222 |
| 86 | St. Albert | Alta. | 68,232 | 65,589 |
| 87 | Norfolk County | Ont. | 67,490 | 64,044 |
| 88 | Grande Prairie | Alta. | 64,141 | 63,166 |
| 89 | Medicine Hat | Alta. | 63,271 | 63,260 |
| 90 | Fredericton | N.B. | 63,116 | 58,721 |
| 91 | Halton Hills | Ont. | 62,951 | 61,161 |
| 92 | Aurora | Ont. | 62,057 | 55,445 |
| 93 | Port Coquitlam | B.C. | 61,498 | 58,612 |
| 94 | Mirabel | Que. | 61,108 | 50,513 |
| 95 | Blainville | Que. | 59,819 | 56,863 |
| 96 | North Vancouver (City) | B.C. | 58,120 | 52,898 |
| 97 | Saint-Hyacinthe | Que. | 57,239 | 55,648 |
| 98 | Welland | Ont. | 55,750 | 52,293 |
| 99 | Belleville | Ont. | 55,071 | 50,716 |
| 100 | North Bay | Ont. | 52,662 | 51,553 |
Detailed tables and analyses are given on the Statistics Canada website.


Is Woodstock,Ontario outside a CMA