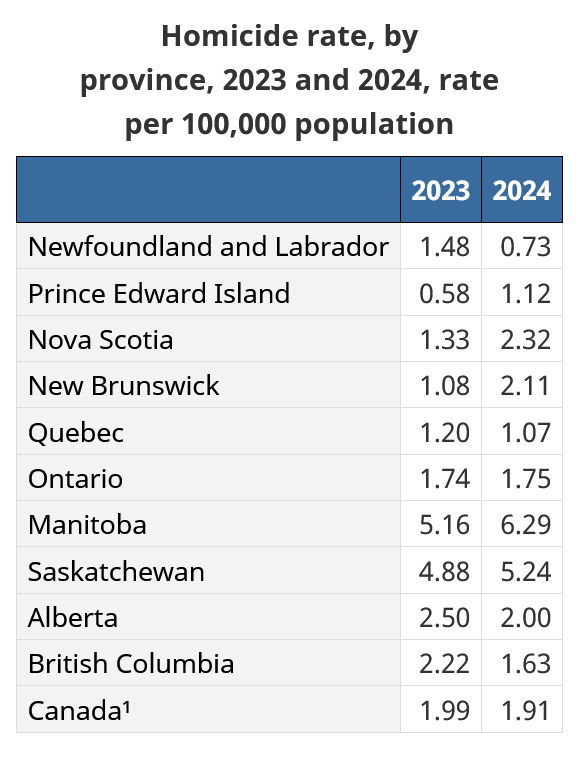
Canada recorded 788 homicides in 2024, a slight decrease from the previous year, marking the second consecutive time the national rate stayed below 2 per 100,000 population, says Statistics Canada in its Homicide trends in Canada, 2024 report.

The decline to 1.91 per 100,000 individuals presents a mixed picture, as trends varied sharply across provinces.
While the national picture shows a modest decrease, the details reveal sharp contrasts between regions, weapon use, victim demographics, and the types of incidents driving the numbers. The report also highlights the continued overrepresentation of Indigenous victims and the rising numbers of youths accused of homicide.
Here are the highlights of the findings:
- Manitoba and Saskatchewan have the homicide rates per 100,000, at 6.29 and 5.24, respectively.
- Newfoundland and Labrador experienced the most significant decline at –51%, followed by British Columbia (–27%), Alberta (–20%), and Quebec (–11%).
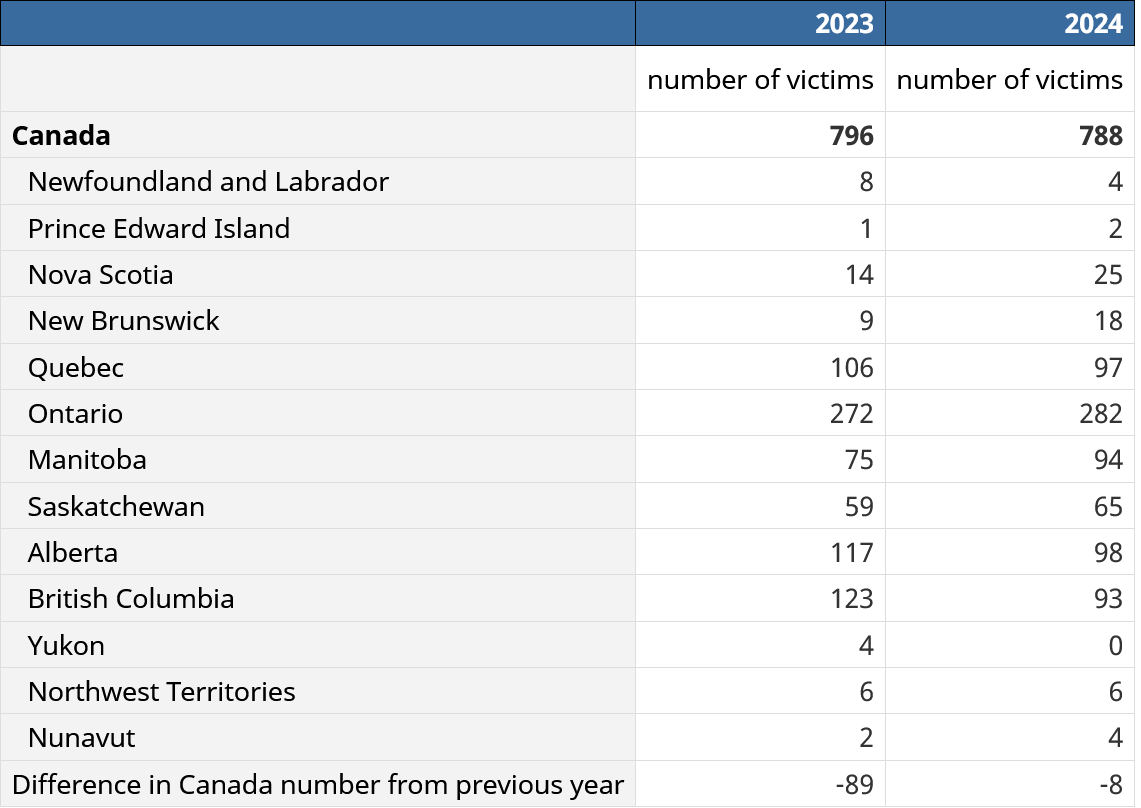
- New Brunswick’s rate nearly doubled, rising from 1.08 to 2.11 per 100,000 with 18 victims, including eight shootings.
- Nova Scotia also saw a marked increase in homicides linked to illegal drug trade activity, growing from 2 to 7 cases, contributing to a jump from 14 to 25 victims.
- Among census metropolitan areas, Thunder Bay recorded the highest rate at 6.08 per 100,000, followed by Chilliwack (4.75) and Winnipeg (4.66). See the table below.
- Firearms remained central to lethal violence, with 36% of all homicides involving guns, and among the 287 firearm-related deaths, handguns accounted for 56%, making them the most common weapon, with rifles and shotguns representing another 34% of firearm incidents nationwide.
- Gang-related killings fell from 174 to 152, driven by fewer drug-trade-related homicides and a drop in firearm-linked gang cases, though the overall share of gang homicides involving guns increased to 79%, while the number of accused in these cases fell from 121 to 95.
- Youth involvement rose as 72 individuals under 18 were charged, up from 65 the previous year, with 13 incidents involving multiple young people and five of those cases involving groups of three or more accused, marking a continued concern in youth-related violence.
- Indigenous peoples represented 30% of homicide victims despite accounting for just 5% of Canada’s population, with Indigenous women experiencing a rise from 50 to 71 victims and Indigenous men from 144 to 152, pushing the homicide rate for Indigenous peoples to 10.84 per 100,000.
- Nearly 29% of victims were racialized individuals, with homicide rates lower than non-racialized groups, and within racialized communities, Black victims comprised 45%, followed by South Asian at 22% and Arab at 9%, showing clear disparities among affected populations.
- A significant portion of accused individuals had prior records, as 42% had previously committed or been accused of crimes against a person, while one-third were under some form of justice supervision, including bail, probation, remand or custody at the time of the offence.
- The number of homicide victims previously reported missing decreased slightly to 41 cases, representing 5% of all victims, with lower percentages among Indigenous victims compared with historical averages despite the overall rise in Indigenous women’s homicides in 2024.
- Intimate partner homicides rose sharply to 100 victims, up from 72, with women making up 81% of those killed, while the number of male victims remained steady, and eight provinces recorded increases, underscoring a persistent gender-based pattern in lethal domestic violence.
Homicide Rate by Census Metropolitan Area
| 2024 Count | 2024 Rate per 100,000 population | 2023 Rate per 100,000 population | |
| Canada | 788 | 1.91 | 1.99 |
| CMAs | 518 | 1.67 | 1.73 |
| 500,000 and over population | |||
| Toronto | 133 | 1.9 | 1.77 |
| Montréal | 58 | 1.24 | 1.24 |
| Vancouver | 37 | 1.19 | 1.61 |
| Calgary | 23 | 1.29 | 1.49 |
| Edmonton | 36 | 2.2 | 3.07 |
| Ottawa | 27 | 2.1 | 1.45 |
| Winnipeg | 43 | 4.66 | 5.15 |
| Québec | 3 | 0.34 | 1.04 |
| Hamilton | 10 | 1.21 | 1.36 |
| Kitchener–Cambridge–Waterloo | 5 | 0.71 | 0.74 |
| London | 10 | 1.59 | 1.31 |
| Oshawa | 11 | 1.93 | 1.65 |
| St. Catharines–Niagara | 15 | 2.78 | 2.29 |
| Halifax | 11 | 2.07 | 1.54 |
| 100,000 to less than 500,000 population | |||
| Windsor | 6 | 1.24 | 1.07 |
| Victoria | 2 | 0.45 | 0.46 |
| Saskatoon | 14 | 3.75 | 3.63 |
| Gatineau | 5 | 1.38 | 1.41 |
| Barrie | 2 | 0.68 | 0.35 |
| Regina | 6 | 2.14 | 3.69 |
| Kelowna | 2 | 0.8 | 2.04 |
| St. John’s | 2 | 0.87 | 1.33 |
| Sherbrooke | 3 | 1.33 | 0.91 |
| Abbotsford–Mission | 4 | 1.8 | 1.86 |
| Moncton | 1 | 0.51 | 2.67 |
| Greater Sudbury | 2 | 1.02 | 2.65 |
| Kingston | 5 | 2.63 | 0 |
| Saguenay | 2 | 1.13 | 0 |
| Brantford | 3 | 1.72 | 0 |
| Trois-Rivières | 1 | 0.58 | 0.6 |
| Guelph | 3 | 1.88 | 2.56 |
| Peterborough | 2 | 1.38 | 2.87 |
| Saint John | 3 | 2.12 | 1.44 |
| Lethbridge | 1 | 0.72 | 0.75 |
| Fredericton | 5 | 3.75 | 0.79 |
| Thunder Bay | 8 | 6.08 | 5.41 |
| Nanaimo | 2 | 1.57 | 2.4 |
| Chilliwack | 6 | 4.75 | 4.84 |
| Kamloops | 1 | 0.8 | 3.27 |
| Belleville–Quinte West | 3 | 2.43 | 1.65 |
| Drummondville | 0 | 0 | 0 |
| Red Deer | 2 | 1.77 | 0.92 |
Credit: Statistics Canada/Source(s): Homicide Survey (3315).


