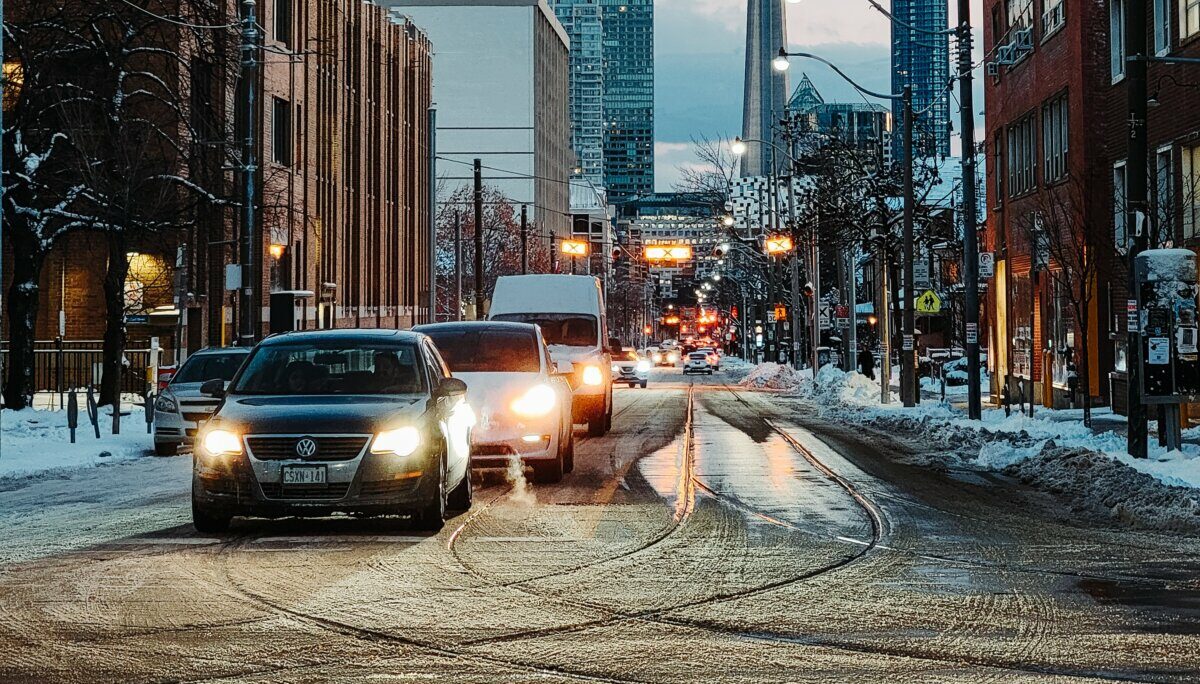
Traffic in downtown Toronto is so bad that it is now the 3rd worst in the whole world, according to TomTom’s annual Traffic Index.
TomTom, a prominent company in geolocation technology, released its 13th annual TomTom Traffic Index. The 2023 report, encompassing 387 cities across 55 countries, is derived from data from over 600 million navigation systems and smartphones. This comprehensive study calculates the average travel time per kilometre based on millions of kilometres driven.
Of the 387 cities assessed, 82 maintained their average speed from the previous year, while 77 cities experienced increased average speeds, leading to reduced journey times. Conversely, in 228 cities, average speeds declined.
This slowdown in traffic speed has financial and environmental repercussions. In over 60% of the 351 cities analyzed for fuel costs, the average fuel expenditure rose by at least 15% between 2021 and 2023. This increase correlates with longer journey times, consequently elevating average CO2 emissions per vehicle.
London and Dublin emerged as the cities with the lowest average speeds in the city centre (5km radius), where a 10-kilometer journey now takes an additional minute compared to 2022.
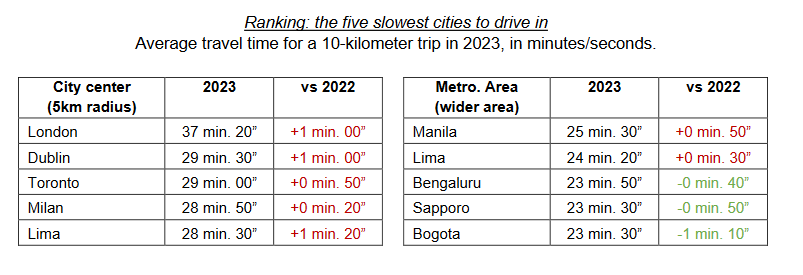
Credit: TomTom Traffic Index
Focusing on Toronto, Canada’s largest city, travel times saw a significant increase in 2023. The average duration to cover 10 kilometers increased by 50 seconds compared to the previous year, leading to an average travel time of 29 minutes and 50 seconds. This places Toronto third in the global ranking for average travel time per 10 kilometres. In total, drivers in Toronto spent an additional 98 hours in traffic due to congestion, 6 hours and 55 minutes more than in 2022.
The worst day to travel in Toronto is Wednesday from 5 PM – 6 PM, when the average time to travel 10 km is 37 min 50 s.
The data, derived from 551 billion kilometres of worldwide trip information, indicates that the worst day for travel in Toronto in 2023 was November 30, with an average travel time of 33 minutes for 10 kilometres. The most congested times were found during weekday rush hours. In the morning, an additional 11 minutes were added to each 10-kilometer journey, while the evening rush hour saw an increase of 15 minutes.
Traffic Congestion in Canada – City Centre
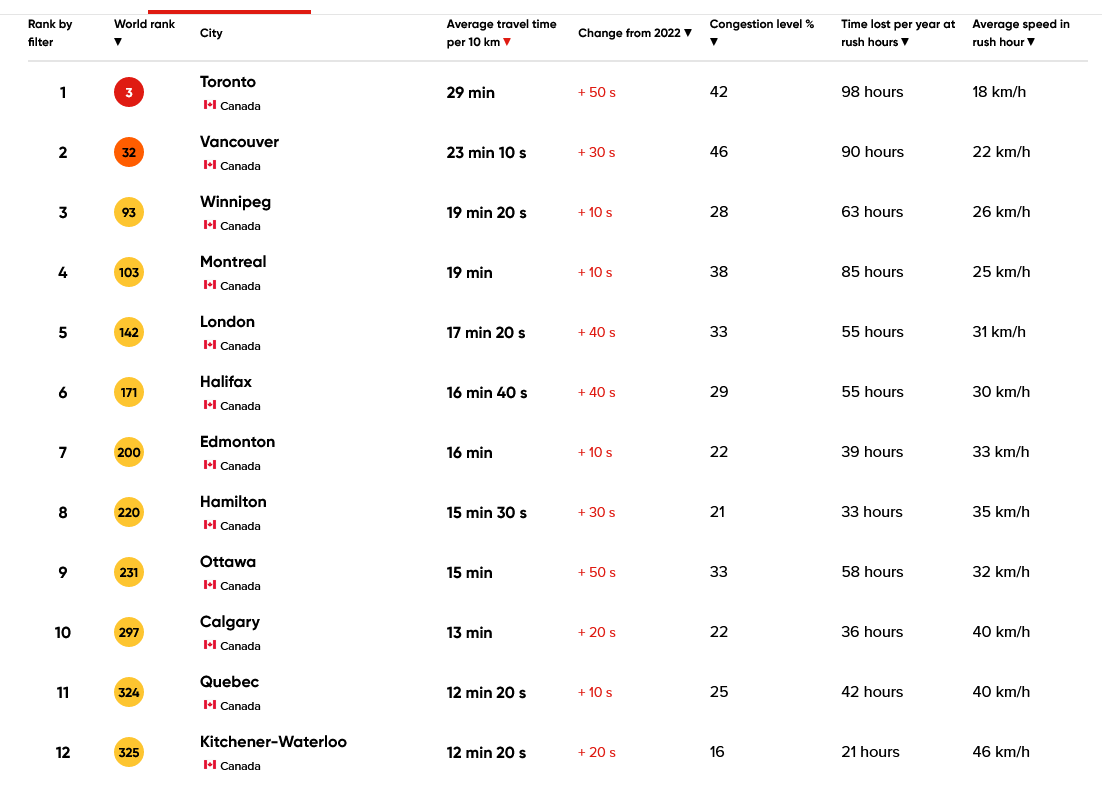
City Centre Traffic Congestion/Credit: TomTom Traffic Index
Within Canada, Vancouver takes the second spot, with average travel times reaching 23 minutes and 10 seconds for the same distance, a year-over-year increase of 30 seconds. Other cities like Winnipeg (3rd), Montreal (4th), and Edmonton(7th) saw modest increases in travel time, between 10 to 40 seconds, indicating growing traffic issues.
Among the analyzed cities, Calgary (10th) and Quebec (11th) emerge with lower congestion, with average 10 km travel times being approximately 13 minutes, slightly up by 20 and 10 seconds, respectively, compared to the previous year. Kitchener-Waterloo (12th), with the lowest congestion level of 16%, reports an average travel time of 12 minutes and 20 seconds for 10 km, pointing to more efficient traffic flow.
Compared to Toronto’s 98 hours, the annual time lost is only 21 hours in Kitchener-Waterloo. Other cities like Ottawa (9th) and Hamilton (8th) also report higher congestion levels, resulting in over 30 hours lost annually.
Traffic Congestion in Canada – Metro Area
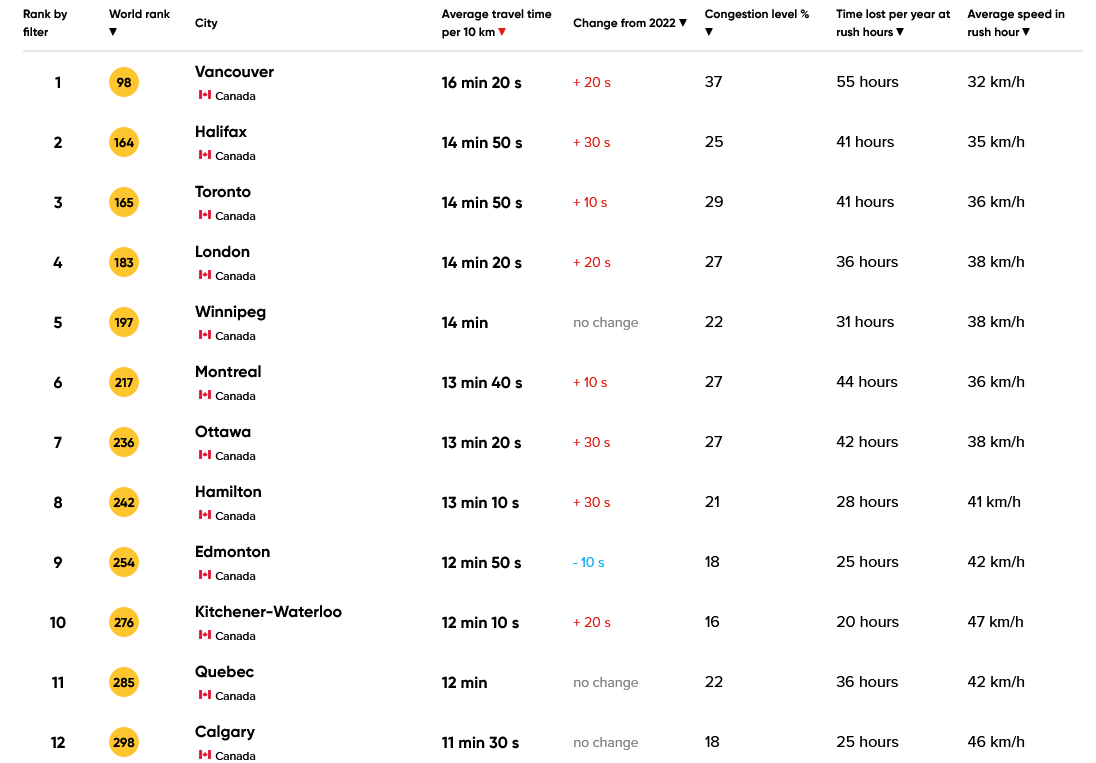
Metro Area Traffic Congestion/Credit: TomTom Traffic Index
While considering the wider metro area, Toronto fares much better in world rankings at 165.
Vancouver sits at the top of the list, with an average journey time of 16 minutes and 20 seconds for every 10 km traveled, marking an increase of 20 seconds from the previous year. The city also records a congestion level of 37%, with drivers spending 55 hours in traffic during peak rush hours annually.
Halifax and Toronto follow closely, each with an average travel time of 14 minutes and 50 seconds per 10 km. Halifax’s congestion level stands at 25%, with a total of 41 hours lost to rush hour traffic, while Toronto, despite its higher congestion level of 29%, mirrors Halifax in the time lost to congestion.
Other notable cities like London, Winnipeg, and Montreal show marginal year-over-year increases in travel times, ranging from 10 to 20 seconds, with congestion levels hovering around 27%. Notably, Winnipeg maintained its previous year’s average travel time of 14 minutes per 10 km.
Cities such as Ottawa, Hamilton, and Edmonton also experienced slight increases in travel time but showcased different congestion levels and speeds. Edmonton notably improved, reducing its average travel time by 10 seconds.
Kitchener-Waterloo and Quebec maintained consistent travel times year-over-year, with Kitchener-Waterloo boasting the highest average speed of 47 km/h during rush hours and the lowest time lost to traffic at 20 hours annually.
Calgarians experienced the least traffic congestion among the analyzed cities, maintaining travel time and average speed as last year.


