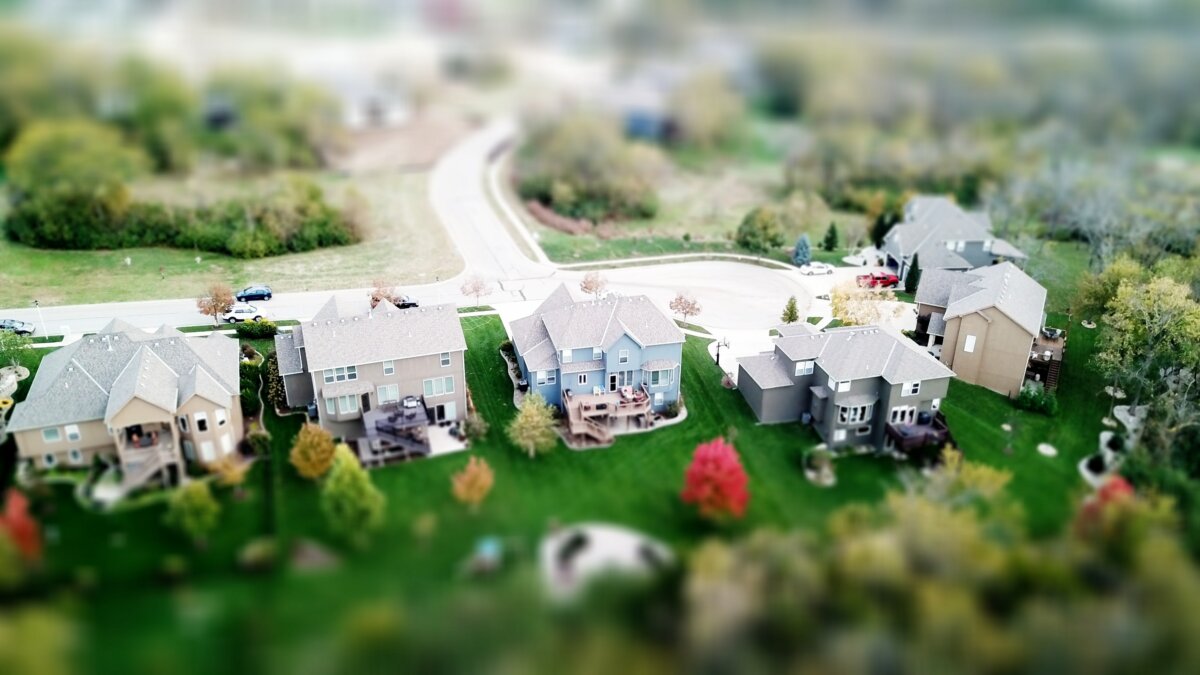
Single-family homes in 18 cities and condos in 26 cities saw a significant decrease in value over the last year, reducing home equity for those who purchased houses in the previous years, while some cities saw rapid increases, finds Point2, a real estate website in its recent analysis of the 67 largest Canadian cities with a population of 90,000 residents or more.
Changes in Home Prices:
The city of Burlington in Ontario emerged as the most regrettable market for new homeowners of single-family homes. Individuals who purchased homes there at the end of 2022 saw their investments decline by $163 daily, resulting in a nearly $60,000 loss over one year.
In Ontario, besides Burlington, homeowners in Kitchener, Mississauga, and Markham experienced daily losses of $109, $114, and $154 respectively, translating to annual losses ranging from $39,850 to $56,043. This downturn, although appearing modest percentage-wise, amounted to significant financial impacts under challenging market conditions.
The trend of decreasing property values was not limited to Ontario. Homeowners in Kelowna, BC; Victoria, BC; and Regina, SK, also witnessed a reduction in equity. Contrastingly, property values in five BC cities—Vancouver, Richmond, Burnaby, Langley, and Delta—soared, with increases exceeding $100,000 and even reaching $200,000 in some cases.
Changes in Condo Prices:
Condo markets experienced more widespread declines, with 26 cities reporting year-over-year price drops finds Point 2.
Condo buyers in Mississauga, ON, faced the largest financial setback, with their properties depreciating by $100 daily or $36,600 annually.
The steepest percentage declines occurred in Lethbridge, AB; London, ON; and Mississauga, ON. The most significant financial losses for condo owners were in Barrie, ON; Victoria, BC; and Mississauga, ON, where daily depreciations ranged from $77 to $100.
However, it wasn’t all negative. Condo owners in Coquitlam, BC; Halifax, NS; Richmond, BC; and Calgary, AB saw their property values increase by more than $50,000 within a year.
Several cities reported daily gains of at least $100 for condo owners, highlighting pockets of growth amidst the downturn.
Changes in Home Equity: 2023 vs 2022
| City | Province | Single Family Home Price 2023 | Percentage Change 2023 vs. 2022 | Net Change 2023 vs. 2022 | Condo/Apartment Price 2023 | Percentage Change 2023 vs. 2022 | Net Change 2023 vs. 2022 |
|---|---|---|---|---|---|---|---|
| Burlington | ON | $1,200,817 | -4.7% | -$59,583 | $606,400 | 0.3% | $1,700 |
| Markham | ON | $1,686,366 | -3.2% | -$56,043 | $696,700 | -1.2% | -$8,400 |
| Mississauga | ON | $1,296,372 | -3.1% | -$41,740 | $599,000 | -5.8% | -$36,600 |
| Kitchener | ON | $766,700 | -4.9% | -$39,850 | $463,600 | 9.2% | $39,150 |
| Kelowna | BC | $966,500 | -3.6% | -$35,900 | $480,800 | -4.4% | -$22,000 |
| Milton | ON | $1,223,226 | -2.4% | -$30,544 | $640,700 | -0.7% | -$4,300 |
| Oakville | ON | $1,660,253 | -1.7% | -$28,815 | $675,400 | -0.1% | -$700 |
| Brampton | ON | $1,097,204 | -2.6% | -$28,797 | $552,400 | -3.0% | -$17,300 |
| Whitby | ON | $1,085,442 | -2.2% | -$24,297 | $605,100 | -1.2% | -$7,100 |
| Richmond Hill | ON | $1,802,089 | -1.3% | -$23,576 | $641,500 | 0.0% | -$100 |
| Oshawa | ON | $824,613 | -2.8% | -$23,451 | $528,600 | 2.9% | $15,000 |
| Ajax | ON | $1,060,073 | -1.8% | -$19,056 | $578,800 | 2.2% | $12,700 |
| St. Catharines | ON | $629,700 | -1.8% | -$11,800 | $431,900 | -4.1% | -$18,400 |
| Niagara Falls | ON | $629,700 | -1.8% | -$11,800 | $431,900 | -4.1% | -$18,400 |
| Cambridge | ON | $727,000 | -0.8% | -$5,900 | $497,700 | 1.6% | $7,700 |
| Regina | SK | $322,469 | -0.8% | -$2,646 | $211,600 | 0.7% | $1,400 |
| Victoria | BC | $1,087,150 | -0.1% | -$850 | $632,350 | -4.3% | -$28,250 |
| Pickering | ON | $1,193,723 | 0.0% | -$377 | $618,800 | -1.3% | -$8,000 |
| Hamilton | ON | $796,419 | 0.0% | $122 | $476,900 | -3.3% | -$16,300 |
| Clarington | ON | $891,744 | 0.4% | $3,531 | $540,300 | -3.0% | -$16,500 |
| Barrie | ON | $773,600 | 0.6% | $4,900 | $496,900 | -5.3% | -$28,000 |
| Toronto | ON | $1,525,371 | 0.4% | $5,523 | $711,200 | -3.2% | -$23,200 |
| Brantford | ON | $681,400 | 1.2% | $8,200 | $379,400 | -1.4% | -$5,400 |
| Longueuil | QC | $496,644 | 1.8% | $8,764 | $331,516 | 0.6% | $2,004 |
| Winnipeg | MB | $346,600 | 3.0% | $10,200 | $228,000 | 2.9% | $6,500 |
| Lévis | QC | $335,000 | 3.5% | $11,250 | $219,500 | 5.0% | $10,500 |
| Edmonton | AB | $441,000 | 2.8% | $12,000 | $232,000 | 6.4% | $14,000 |
| Strathcona County | AB | $435,000 | 2.8% | $12,000 | $240,000 | 4.8% | $11,000 |
| St. John’s | NL | $347,400 | 4.3% | $14,300 | $238,400 | 4.7% | $10,600 |
| London | ON | $616,700 | 2.6% | $15,500 | $355,100 | -6.0% | -$22,600 |
| Sherbrooke | QC | $357,000 | 5.0% | $17,000 | $265,000 | 8.2% | $20,000 |
| Chatham-Kent | ON | $402,500 | 4.5% | $17,333 | N/A | N/A | N/A |
| Windsor | ON | $604,500 | 3.1% | $18,100 | $392,000 | 1.9% | $7,200 |
| Kingston | ON | $557,100 | 3.4% | $18,400 | $430,200 | -0.3% | -$1,400 |
| Ottawa | ON | $704,900 | 2.7% | $18,600 | $417,200 | 2.1% | $8,500 |
| Gatineau | QC | $421,000 | 5.3% | $21,000 | $299,350 | 5.0% | $14,350 |
| Thunder Bay | ON | $299,500 | 8.6% | $23,600 | N/A | N/A | N/A |
| Saskatoon | SK | $421,750 | 6.0% | $23,932 | $223,400 | -0.4% | -$900 |
| Kamloops | BC | $650,000 | 3.9% | $24,300 | $375,500 | 4.2% | $15,100 |
| Waterloo | ON | $823,050 | 3.1% | $25,100 | $475,600 | -1.2% | -$5,750 |
| Montréal | QC | $680,000 | 4.1% | $26,800 | $446,000 | 2.5% | $11,000 |
| Saint-Jean-sur-Richelieu | QC | $447,500 | 6.5% | $27,500 | N/A | N/A | N/A |
| Terrebonne | QC | $483,700 | 6.1% | $27,700 | $340,000 | 5.9% | $19,000 |
| Halifax | NS | $520,800 | 5.9% | $29,200 | $455,500 | 14.2% | $56,500 |
| Guelph | ON | $839,900 | 3.7% | $29,900 | $530,400 | -0.1% | -$400 |
| Saguenay | QC | $266,500 | 14.9% | $34,500 | N/A | N/A | N/A |
| Nanaimo | BC | $781,900 | 5.3% | $39,700 | $392,700 | 4.0% | $15,200 |
| Trois-Rivières | QC | $326,871 | 13.9% | $39,871 | $250,000 | 4.2% | $10,000 |
| Laval | QC | $530,000 | 9.1% | $44,000 | $390,000 | 9.6% | $34,000 |
| Vaughan | ON | $1,662,181 | 2.8% | $44,946 | $693,800 | -0.1% | -$700 |
| Lethbridge | AB | $415,603 | 12.5% | $46,153 | $221,183 | -6.1% | -$14,369 |
| Québec City | QC | $370,000 | 14.9% | $48,000 | $250,000 | 4.2% | $10,100 |
| Brossard | QC | $699,000 | 7.5% | $49,000 | $367,500 | -4.8% | -$18,500 |
| Red Deer | AB | $381,984 | 16.0% | $52,737 | $170,863 | -3.0% | -$5,284 |
| Greater Sudbury | ON | $422,400 | 15.0% | $55,100 | N/A | N/A | N/A |
| Chilliwack | BC | $862,400 | 7.4% | $59,100 | $356,100 | 9.2% | $30,100 |
| Saanich | BC | $1,228,932 | 5.3% | $61,812 | $553,814 | 1.6% | $8,906 |
| Calgary | AB | $662,250 | 12.4% | $73,200 | $321,400 | 19.1% | $51,600 |
| Maple Ridge | BC | $1,245,000 | 6.7% | $78,400 | $533,500 | 5.0% | $25,200 |
| Coquitlam | BC | $1,777,800 | 4.7% | $79,400 | $711,800 | 9.0% | $58,500 |
| Surrey | BC | $1,601,400 | 6.0% | $91,000 | $529,100 | 5.3% | $26,500 |
| Abbotsford | BC | $1,167,100 | 9.3% | $99,200 | $446,400 | 10.4% | $42,200 |
| Delta | BC | $1,438,533 | 8.0% | $106,267 | $664,333 | 4.7% | $30,100 |
| Langley | BC | $1,606,500 | 8.2% | $122,200 | $596,400 | 5.1% | $28,700 |
| Burnaby | BC | $1,994,267 | 6.8% | $126,300 | $775,267 | 5.1% | $37,700 |
| Richmond | BC | $2,111,400 | 6.7% | $133,200 | $744,000 | 7.9% | $54,600 |
| Vancouver | BC | $2,535,257 | 9.0% | $208,858 | $784,314 | 0.4% | $3,423 |
Point2 says the latter part of last year hinted at a market recovery, with fewer cities experiencing declines in single-family home values from November to December. This shift suggests that, despite the immediate setbacks, the real estate market might be on a path to recovery, with long-term investors potentially seeing a return to equity growth.
Per the news release, the analysis, conducted by Point2, a division of Yardi Systems Inc., utilized a comprehensive methodology including internal data, public records, and various reliable sources to offer insights into the current state of Canada’s housing market.


